Extraordinary new chart from the warrior mamas at OpenVAERS
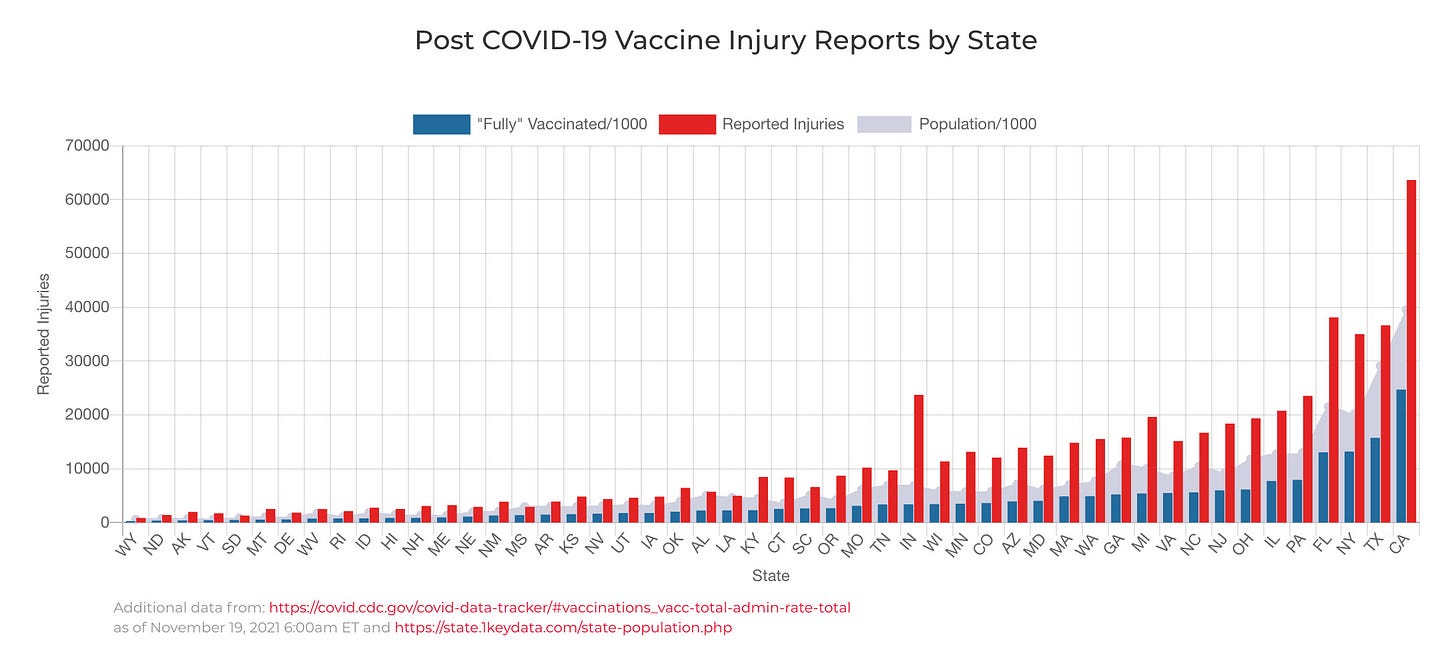
Population, vaccination rate, and COVID vaccine injury reports for all 50 states
Vaccine injury is everywhere. The federal government collects reports of vaccine injury through the Vaccine Adverse Events Reporting System (VAERS). The system is intentionally clunky and difficult to navigate.
So some warrior mamas created OpenVAERS that takes all of the federal reports and makes them easily searchable. Pharma and the bougie mainstream are terrified of OpenVAERS because by making the reports easily searchable it wakes lots of people up to the catastrophic harms from vaccines.
OpenVAERS started before COVID. But with the introduction of COVID vaccines, OpenVAERS has become even more important. OpenVAERS tracks COVID vaccine injuries every week through what has become known as the Red Box Summaries. The Red Box Summaries are so powerful that Facebook and Instagram have programmed their artificial intelligence to censor screenshots from OpenVAERS in order to protect the Pharma cartel.
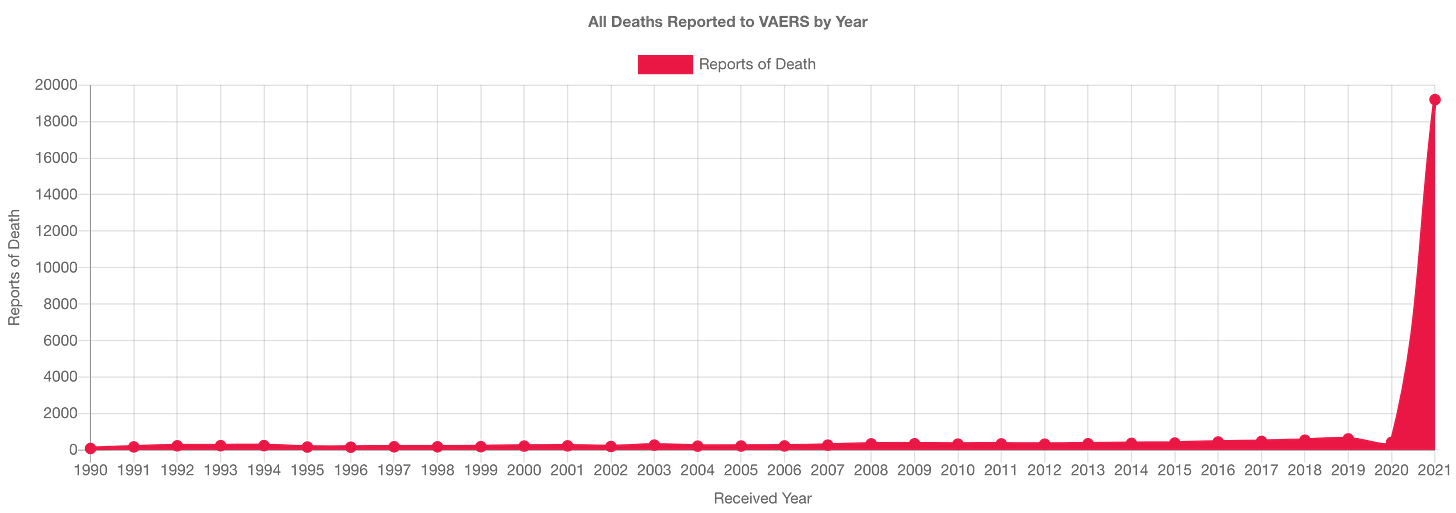
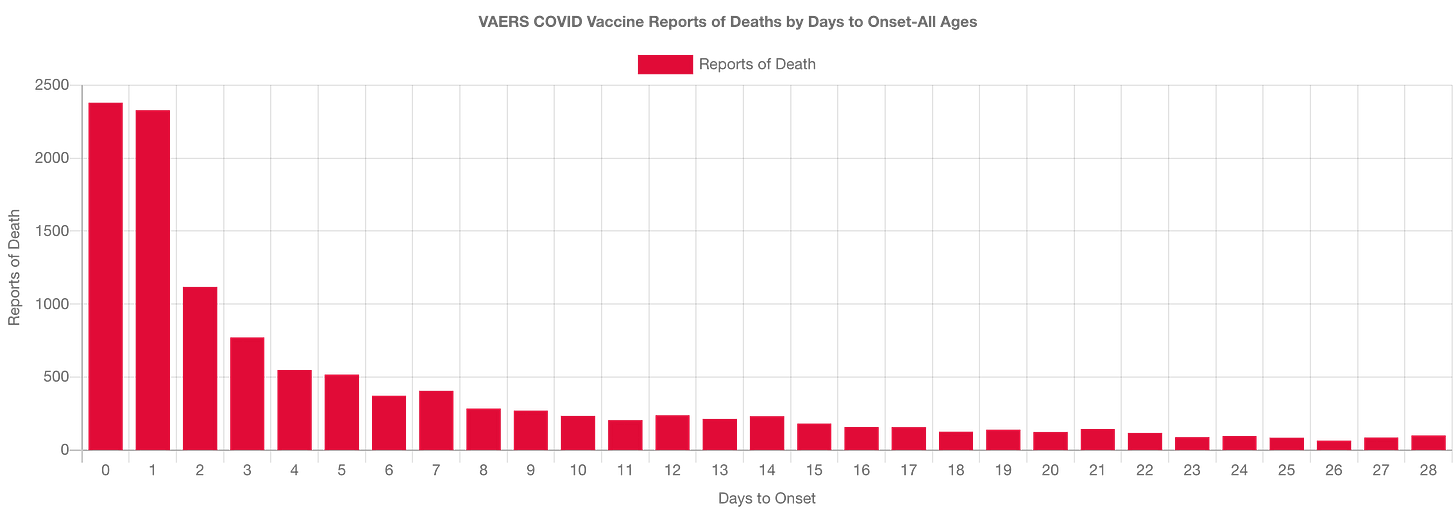
Over time, OpenVAERS has added additional charts and graphs to help people understand the data and its context. For example these two charts are better than anything produced by the federal government during this whole debacle.
This week the warrior mamas at OpenVAERS outdid themselves. They produced a new chart (below) that graphs the number "Fully" vaccinated (divided by 1,000), the number of covid vaccine injuries reported to VAERS, and the population (divided by 1,000) for all 50 states.
As you can see, the number of covid vaccine injury reports in each state corresponds to the number of people fully vaccinated in that state. While this is obvious to everyone who has been paying attention, this will be a revelation to people who tried to bury their head in the sand in hopes that this problem would go away on its own.
The U.S. Department of Health and Human Services reports that a majority of VAERS reports are sent in by vaccine manufacturers (37%) and health care providers (36%). The remaining reports are obtained from state immunization programs (10%). Only 7% of VAERS reports are submitted by the vaccine injured and their families (with 10% of reports from other sources).
Nearly every independent scholar who has studied VAERS agrees that it is a significant undercount of actual vaccine harms.
Former FDA Director David Kessler in an article in the Journal of the American Medical Association stated that “only about 1% of serious events are reported to the FDA.” A report for the U.S. Department of Health and Human Services by Harvard Pilgrim Healthcare Inc. confirmed that VAERS undercounts actual vaccine injuries by a factor of 100.
More recently several scholars have attempted to refine these initial estimates.
Kirsch, Rose, and Crawford estimate that VAERS undercounts fatal vaccine reactions by a factor of 41.
Dr. Jessica Rose, a statistician in Israel, recently calculated an under-reporting factor of 31 for all severe adverse events following vaccination.
We are in the midst of the most catastrophic vaccine campaign in U.S. history.
Sign up at OpenVAERS to have their weekly reports delivered to your email inbox for free.
Mess with a mama bear you’re gonna get mauled.


The FDA/CDC has issued a huge recall off onions. 892 'illnesses' linked to the onions. If only the jabs were held to the same standard as onions.
I love OpenVAERS and reference their incredibly valuable Red Box Summaries, charts, and searchable reports frequently, including in “Letter to a Holocaust Denier” (https://margaretannaalice.substack.com/p/letter-to-a-holocaust-denier).
I did not, however, know about this new chart, which is fascinating and extraordinarily revealing. Thank you for alerting us to this, Toby!